Table of contents:
- Spectroscopic Analysis (UV-Visible Spectroscopy)
- Transmission Electron Microscopy (TEM)
- Dynamic Light Scattering (DLS)
- Zeta Potential
- Inductively Coupled Plasma Mass Spectrometry (ICP-MS)
- Dark Field Microscopy
- Aerodynamic Particle Sizer (APS)
- Scanning Mobility Particle Sizer (SMPS)
- Matrix-assisted Laser Desorption/Ionization Mass Spectrometry (MALDI-MS)
Spectroscopic Analysis (UV-Visible Spectroscopy)
UV/Visible spectroscopy is a technique used to quantify the light that is absorbed and scattered by a sample (a quantity known as the extinction, which is defined as the sum of absorbed and scattered light). In its simplest form, a sample is placed between a light source and a photodetector, and the intensity of a beam of UV/visible light is measured before and after passing through the sample. These measurements are compared at each wavelength to quantify the sample’s wavelength dependent extinction spectrum. The data is typically plotted as extinction as a function of wavelength. Each spectrum is background corrected using a buffer blank to guarantee that spectral features from the buffer are not included in the sample extinction spectrum.
Gold and silver plasmonic nanoparticles have optical properties that are sensitive to size, shape, concentration, agglomeration state, and refractive index near the nanoparticle surface, which makes UV/Vis spectroscopy a valuable tool for identifying, characterizing, and studying nanomaterials. The measured spectrum can be compared to the predicted spectrum based on numerical models. Non-plasmonic nanoparticles also have size and concentration dependent optical properties, however, their spectrum is not as sensitive to the dispersion properties as plasmonic nanoparticles.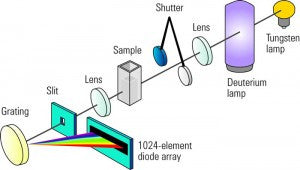
At nanoComposix, UV-Vis analysis is performed with an Agilent 8453 single beam diode array spectrometer which collects spectra from 200-1100 nm using a slit width of 1 nm. Deuterium and tungsten lamps are used to provide illumination across the ultraviolet, visible, and near-infrared electromagnetic spectrum. Spectra can be collected from samples as small as 60-100 µL using a microcell with a path length of 1 cm.
Order our UV-Vis Analytical Service
Transmission Electron Microscopy (TEM)
 Transmission electron microscopy (TEM) is a high magnification measurement technique that images the transmission of a beam of electrons through a sample. Amplitude and phase variations in the transmitted beam provide imaging contrast that is a function of the sample thickness (the amount of material that the electron beam must pass through) and the sample material (heavier atoms scatter more electrons and therefore have a smaller electron mean free path than lighter atoms). Because this technique uses electrons rather than light to illuminate the sample, TEM imaging has significantly higher resolution than light-based imaging techniques.
Successful imaging of nanoparticles using TEM depends on the contrast of the sample relative to the background. Samples are prepared for imaging by drying nanoparticles on a copper grid that is coated with a thin layer of carbon. Materials with electron densities that are significantly higher than amorphous carbon are easily imaged. These materials include most metals (e.g., silver, gold, copper, aluminum), most oxides (e.g., silica, aluminum oxide, titanium oxide), and other particles such as polymer nanoparticles, carbon nanotubes, quantum dots, and magnetic nanoparticles. TEM imaging is the preferred method to directly measure the particle size, grain size, size distribution, and morphology of nanoparticles. Sizing accuracy is typically within 3% of the actual value.
 At nanoComposix, we use a JEOL 1010 transmission electron microscope operating at an accelerating voltage of 100 keV and an AMT XR41-B 4-megapixel (2048 x 2048) bottom mount CCD camera. The camera’s finite-conjugate optical coupler provides high resolution and flat focus with less than 0.1% distortion for magnifications as high as 150,000x.
Order our TEM Analytical Service
Dynamic Light Scattering (DLS)
Dynamic Light Scattering (DLS) is an important tool for characterizing nanoparticles and other colloidal solutions. DLS measures light scattered from a laser that passes through a colloidal solution. By analyzing the modulation of the scattered light intensity as a function of time, information can be obtained on the size of the particle in solution. The analysis is based on the diffusive motion of particles in solution (Brownian motion) in which larger particles will move more slowly and scatter more light than smaller particles. The hydrodynamic diameter (the diameter of a hypothetical nonporous sphere that diffuses at the same rate as the particles being characterized) can be calculated from the time dependence of the scattering intensity measurements. The hydrodynamic diameter is an important complement to other sizing measurements such as TEM because it provides information on the aggregation state of nanoparticle solutions. Stable unaggregated colloidal solutions will have particles with hydrodynamic diameters similar to or slightly larger than their TEM size while highly aggregated solution will have hydrodynamic diameters that are much larger than the TEM size.
At nanoComposix, DLS measurements are performed on a Malvern Zetasizer Nano ZS instrument equipped with a HeNe laser operating at 632.8 nm and a scattering detector at 173 degrees.
Order our DLS Analytical Service
Zeta Potential
Zeta potential (also known as the electrokinetic potential) is a measure of the “effective” electric charge on the nanoparticle surface, and quantifies the charge stability of colloidal nanoparticles. When a nanoparticle has a net surface charge, the charge is “screened” by an increased concentration of ions of opposite charge near the nanoparticle surface. This layer of oppositely charged ions moves with the nanoparticle, and together the layer of surface charge and oppositely charged ions are referred to as the electrical double layer. The Zeta Potential is a measure of the difference in potential between the bulk fluid in which a particle is dispersed and the layer of fluid containing the oppositely charged ions that is associated with the nanoparticle surface. Particles with a positive Zeta Potential will bind to negatively charged surfaces, and vice versa. 
The magnitude of the Zeta Potential provides information about particle stability, with higher magnitude potentials exhibiting increased electrostatic repulsion and therefore increased stability.
- 0-5 mV: Particles tend to agglomerate or aggregate
- 5-20 mV: Particles are minimally stable
- 20-40 mV: Particles are moderately stable
- 40+ mV: Particles are highly stable
It is important to consider that the magnitude of the charge on the nanoparticle surface depends on the solution pH. In fact, the surface charge can be reduced to zero at a specific pH referred to as the isoelectric point.
Zeta potential is measured by adding a solution to a cell that contains two gold electrodes. When a voltage is applied to the electrode, the particles will move towards the electrode with the opposite charge. A Doppler technique is used to measure the particle velocity as a function of voltage. A laser passes through the cell and as particles move through the laser beam the intensity of scattered light fluctuates at a frequency proportional to the particle speed. Particle speed at multiple voltages is measured, and this data is used to calculate the zeta potential.
At nanoComposix, Zeta Potential measurements are performed using a Malvern Zetasizer Nano ZS instrument equipped with a HeNe laser operating at 632.8 nm and a scattering detector at 173 degrees.
Order our Zeta Potential Analytical Service
Inductively Coupled Plasma Mass Spectrometry (ICP-MS)
Inductively coupled plasma mass spectroscopy (ICP-MS) is a sensitive analytical technique to identify and quantify the elemental composition of samples, including metals and select nonmetals with atomic masses from 7-250. ICP-MS is more sensitive than atomic absorption spectroscopy (AAS), has greater flexibility for quantifying multiple analytes simultaneously, higher throughput, and accommodates smaller volume samples. Additionally, ICP-MS detection limits are generally in the parts per trillion (ppt) or even parts per quadrillion (ppq) range for many elements. The sensitivity of the measurement can be reduced if co-contaminants or plasma interactions bring about interference effects. ICP-MS instruments fitted with a collision cell (including the instrument used at nanoComposix) can overcome many of these interferences.
In ICP, liquid samples are aerosolized in a nebulizer and directed through a high temperature heat source (for example, plasma from argon) to ionize elements by exciting the electrons of individual atoms. The ionized atoms are then separated from neutral particles in a vacuum chamber by an ion guide and detected by a mass spectrometer (MS). The mass-to-charge ratio of the ions is used to separate the elements and the concentration of each element is determined based on the ion signal proportion relative to an internal calibration standard.
Because ICP-MS samples must be in a liquid form to facilitate ionization, sample digestion may be required. Sample volume requirements vary with the concentration of the element of interest in the sample, any interferences present, instrument sensitivity for the element, the number of analysis being conducted, and the number of elements of interest. Sample volumes as low as 100 uL can be measured.
At nanoComposix, we use an Agilent 7800 quadrupole ICP-MS with Octopole Reaction System technology and single-particle ICP-MS capability (sp-ICP-MS). This instrument allows sensitive detection across an 8-order concentration range for metallic elements. In addition to confirming mass concentration of materials synthesized at nanoComposix, we also use ICP-MS for evaluating nanoparticle purity, detecting nanoparticles in environmental samples and biological tissues, and performing particle size distribution (PSD) characterization using sp-ICP-MS mode.
Order our ICP-MS Analytical Service
Dark Field Microscopy
Dark field microscopy is a light microscopy technique that uses oblique incident illumination to image samples. Since the incident beam is not captured by the objective lens except where it has been scattered by the sample, the sample image has a dark background. This technique is frequently used to study plasmonic nanoparticles, where the scattered light from individual nanoparticles is very dim relative to the incident beam. Dark field images of silver nanowires and 60 nm silver nanoparticles are displayed below. Because light microscopy is diffraction limited (and the diameter of a 60 nm silver nanoparticle is less than the wavelength of light), the nanoparticles appear as bright point sources of light.
At nanoComposix, dark field microscopy is performed on an Olympus BX41 microscope with a white light source and a digital camera. High quality 5x, 10x, 20x, and 50x objectives minimize aberrations across magnification ranges.
Aerodynamic Particle Sizer (APS)
Aerodynamic Particle Size (APS) analysis is an important tool for characterizing the size of aerosolized particles or liquid droplets with diameters that range from 500 nm - 20 µm. APS measures changes in the terminal velocity of aerosolized particles. Because particle terminal velocity depends on the particle size, the aerodynamic particle size (the size of a hypothetical nonporous sphere that has the same terminal velocity as the particle being characterized) can be calculated from the measured terminal velocity and an assumed particle density. The terminal velocity is calculated by measuring the time it takes the particle to pass between two spatially separated laser beams.
In order to measure the size distribution and optical properties of aerosols, the samples must be “launched” into an aerosol characterization chamber. At nanoComposix, powdered materials are aerosolized using a variety of methods, including a high pressure air gun, a 1000 psi burst disc, and a venturi pump. Liquid samples are launched using a nebulizer or fog generator nozzle. APS measurements are collected using a TSI Model 3321 Aerodynamic Particle Sizer to provide high resolution sizing measurements of particles in the 500 nm - 20 µm size range with 15 second time resolution.
Scanning Mobility Particle Sizer (SMPS)
The majority of aerosol particle sizing instruments use light scattering to determine the size of the particle. However, when the particle size is below ~500 nm, the small amount of light that is scattered from the particle is difficult to detect. A more accurate measurement can be acquired using a Scanning Mobility Particle Sizer (SMPS) that consists of two complementary instruments: a Differential Mobility Analyzer (DMA) and Condensation Particle Counter (CPC) to measure the electromobility diameter of aerosolized nanoparticles. The DMA determines the particle size by measuring the electrical mobility of particles in response to high voltage electric field. Particles flow down a tube with a center electrode at high voltage and outer tube at ground. A small exit orifice allows those particles with a particular electrical mobility to pass. By changing the voltage, a very narrow range of particle diameters passes through the exit port. Since these particles are too small to be accurately counted by light scattering, the particle size is increased by a CPC that condenses butanol on the surface. After condensation, the particles are individually counted. By counting the number of particles at each voltage, a particle size distribution between 10 and 500 nm is obtained.
In order to measure the size distribution and optical properties of aerosols, the samples must be “launched” into an aerosol characterization chamber. At nanoComposix, powdered materials are aerosolized using a variety of methods, including a high pressure air gun, a 1000 psi burst disc, and a venturi pump. Liquid samples are launched using a nebulizer or fog generator nozzle. SMPS measurements are performed using a TSI Model 3081 Differential Mobility Analyzer and TSI Model 3010 Condensation Particle Counter to provide high resolution sizing measurements of particles in the 10- 500 nm size range with 90 second time resolution.
Matrix-assisted Laser Desorption/Ionization Mass Spectrometry (MALDI-MS)
Matrix Assisted Laser Desorption Ionization time-of-flight Mass Spectrometry (MALDI-tof-MS) is a technique for ionizing small to large organic analytes and biomolecules into the gas phase with minimal fragmentation and their subsequent separation/detection using a time-of-flight mass analyzer. This allows the accurate molecular weight measurement of small to large biomolecules from simple to complex samples to be measured. This technique can be used for both MALDI tissue imaging and more routine protein, peptide, and polymer mass analysis.
Standard MALDI analysis of proteins or peptides using a dried droplet sample preparation, uses a 2,5-DHB matrix (for small molecular weight peptide or chemical samples) or a sinapic acid (SA) and CHCA matrix (for medium-high molecular weight proteins). NanoComposix is actively developing a novel nanoparticle based matrices. Gold nanoparticles have high sensitivity to classes of molecules such as lipid and in many cases can detect molecular signatures that cannot be measured with standard organic matrices. Additionally, only 1/100th of the mass of a nanoparticle matrix is required compared to a standard organic matrix. Tissue imaging research at nanoComposix is performed with both nanoparticle and standard MALDI matrices.
At nanoComposix, MALDI-MS samples are characterized using a Bruker Daltonics AutoFlex II MALDI-MS to provide high mass resolution over a wide mass range.