
UV-Visible spectroscopy (UV-Vis) is a fast, widely used method for characterizing the optical properties of nanoparticles in solution. Nanoparticle extinction spectra can provide information about particle size, concentration, aggregation state, optical resonance, and changes in the environment surrounding the particle surface.
Obtaining meaningful UV-Vis data requires appropriate sample preparation and careful interpretation. This guide explains what a nanoparticle UV-Vis measurement represents, how to collect high-quality spectra, and how to interpret extinction, absorption, scattering, peak position, and spectral changes.
Need optical characterization of your nanoparticles?
Our UV-Visible nanoparticle analysis service measures wavelength-dependent optical extinction to characterize nanoparticle optical response and dispersion state.
On this page
- What UV-Vis Measures
- Sample Preparation and Measurement
- Interpreting UV-Vis Spectra
- Absorption, Scattering, and Extinction
- How Nanoparticle Properties Affect UV-Vis Spectra
- Monitoring Nanoparticle Aggregation
- Troubleshooting UV-Vis Measurements
What Does UV-Vis Spectroscopy Measure?
In a conventional UV-Vis measurement, a beam of light passes through a sample and the instrument compares the intensity of transmitted light with the incident intensity across a range of wavelengths.
The fraction of incident light transmitted through the sample is the transmittance:
T = I / I0
where I is the transmitted intensity and I0 is the incident intensity.
Absorbance, or optical density, is related to transmittance by:
A = −log10(T)
For molecular solutions with negligible scattering, this attenuation is primarily caused by absorption. Nanoparticle suspensions are different because particles can both absorb and scatter incident light.
A standard transmission spectrophotometer detects light that remains in the incident beam. Light absorbed by the nanoparticles or scattered away from the detector both reduce the measured transmitted intensity. For nanoparticle samples, the resulting spectrum is therefore more accurately described as an extinction spectrum:
Extinction = Absorption + Scattering
| Optical Property | Meaning |
|---|---|
| Absorption | Incident optical energy is absorbed by the particle and converted to another form of energy, such as heat. |
| Scattering | Incident light is redirected away from its original direction. |
| Extinction | Total loss of light from the incident beam due to absorption and scattering. |
| Transmittance | Fraction of incident light that passes through the sample and reaches the detector. |
Unless an experimental configuration specifically separates absorption and scattering, a standard nanoparticle UV-Vis spectrum should generally be interpreted as extinction rather than pure absorption.
Why UV-Vis Is Useful for Nanoparticles
Nanoparticle optical properties can be highly sensitive to particle size, shape, composition, concentration, aggregation state, and the refractive index of the surrounding environment. This sensitivity makes UV-Vis particularly useful for plasmonic nanoparticles such as gold and silver.
UV-Vis can also provide useful information for dielectric, semiconductor, and other nanoparticle systems that absorb or scatter within the instrument's spectral range.
Sample Preparation and UV-Vis Measurement
UV-Vis is straightforward to perform, but sample handling can substantially affect the resulting spectrum. Use consistent preparation and measurement conditions when comparing nanoparticle samples.
Use an Appropriate Blank
Every nanoparticle spectrum should be background corrected using a blank that matches the dispersing medium as closely as possible. The blank accounts for wavelength-dependent absorption or scattering from the solvent, buffer, salts, surfactants, and other soluble formulation components.
If the nanoparticle sample is diluted before measurement, prepare the blank using the same medium used for dilution.
Select the Right Cuvette
Choose a cuvette that transmits light across the wavelength range being measured. Quartz cuvettes are generally preferred when measurements extend into the ultraviolet because common glass and plastic materials may absorb strongly at shorter wavelengths.
Keep path length consistent when comparing samples. A 1 cm path length is common, but shorter-path cells may be useful for concentrated or strongly extinguishing samples.
Before measurement:
- Confirm that the cuvette material is compatible with the solvent.
- Use clean, unscratched optical surfaces.
- Remove bubbles from the optical path.
- Wipe fingerprints, droplets, and residue from the outside of the cuvette.
- Use consistent cuvette orientation when high measurement precision is required.
Choose an Appropriate Sample Concentration
The sample should produce sufficient extinction for a clear spectrum while remaining within the linear photometric range of the instrument. Excessively concentrated samples can transmit too little light and may produce flattened peaks, increased noise, or other artifacts.
If a sample is too concentrated, dilute it using an appropriate matched dispersant and record the dilution factor. If quantitative comparison is required, confirm that spectral intensity scales proportionally with dilution over the concentration range being used.
Very dilute nanoparticle samples can also become challenging when their extinction approaches the background noise of the instrument.
Mix the Sample Before Measurement
Ensure that the measured aliquot represents the full sample. Gently redisperse nanoparticles that settle during storage according to the handling requirements of the formulation.
Avoid introducing bubbles or altering the nanoparticle aggregation state simply to improve the appearance of the spectrum. When sonication or other processing is required, document the method so measurements can be reproduced.
Interpreting Nanoparticle UV-Vis Spectra
A nanoparticle UV-Vis spectrum can contain information in its peak position, intensity, width, shape, and wavelength-dependent baseline. Interpretation should consider all of these features rather than relying only on the wavelength of maximum extinction.
| Spectral Feature | What It Can Indicate |
|---|---|
| Peak wavelength (λmax) | Optical resonance position; may respond to particle size, shape, composition, surrounding refractive index, or particle-particle interactions. |
| Peak intensity | Depends on particle concentration, optical cross section, path length, and dispersion state. |
| Peak width | Can reflect particle heterogeneity, damping, aggregation, or overlapping optical modes. |
| Long-wavelength extinction | Can indicate increased scattering, aggregation, or the presence of larger particles. |
| Spectral shift | May result from changes in particle geometry, refractive index near the surface, aggregation, or other changes to the optical environment. |
Raw, Dilution-Corrected, and Normalized Spectra
How a spectrum is processed should depend on the question being asked.
- Raw extinction: Use when the measured optical density itself is important.
- Dilution-corrected extinction: Multiply by the appropriate dilution factor when comparing samples measured at different dilutions, provided the measurement remains within the linear range of the instrument.
- Normalized spectrum: Scale spectra to a common maximum when comparing peak position, width, or spectral shape independent of absolute intensity.
Normalization removes information about absolute spectral intensity and should therefore not be used when comparing nanoparticle concentration or extinction strength.
Beer-Lambert Behavior and Nanoparticle Concentration
For an appropriately dilute, stable dispersion, extinction can often scale approximately with concentration and optical path length according to the Beer-Lambert relationship:
A = εbc
where A is extinction or absorbance, ε is the wavelength-dependent extinction coefficient, b is optical path length, and c is concentration.
If the extinction coefficient for a particular nanoparticle is known, UV-Vis can therefore be used to estimate concentration. This relationship should be applied carefully to nanoparticle dispersions because multiple scattering, aggregation, concentration-dependent particle interactions, or changes in refractive index can cause deviations from simple Beer-Lambert behavior.
UV-Vis Data Analysis Tools and Tutorials
The nanoComposix UV-Vis data analysis spreadsheet can be used to generate normalized and dilution-corrected spectra:
Download the UV-Vis Data Analysis Spreadsheet
For practical measurement guidance, see our three-part video tutorial series:
- UV-Vis Tutorial Part 1: Introduction to Measuring Nanoparticles
- UV-Vis Tutorial Part 2: Performing a Quantitative Measurement
- UV-Vis Tutorial Part 3: Data Analysis
Absorption, Scattering, and Extinction
The relative contributions of absorption and scattering depend strongly on particle size, composition, shape, and wavelength. Two samples with superficially similar extinction spectra can interact with light through very different mechanisms.
Absorption-Dominated Nanoparticles
Small metallic nanoparticles can have optical responses dominated by absorption. For example, very small gold nanoparticles scatter relatively little visible light compared with the amount they absorb.
Scattering-Dominated Nanoparticles
As particle dimensions increase, scattering generally becomes more important. Large dielectric particles such as silica can exhibit strong elastic scattering even when the material itself absorbs very little visible light.
For particles much smaller than the wavelength of light, scattering can often be approximated using the Rayleigh regime. As particle dimensions approach the wavelength of light, more complete descriptions such as Mie theory are required.
Most nanoparticle samples contain contributions from both absorption and scattering. A standard transmission UV-Vis measurement does not independently separate these contributions.
Using Mie Theory to Interpret Optical Spectra
For homogeneous spherical and concentric core-shell nanoparticles, Mie theory can calculate wavelength-dependent extinction, absorption, and scattering from particle size, composition, shell structure, and the refractive index of the surrounding medium.
The nanoComposix Mie Theory Calculator can be used to explore these relationships and compare calculated absorption, scattering, and total extinction spectra.
Mie theory is particularly useful for understanding how increasing particle size changes the balance between absorption and scattering. It can also help distinguish whether a measured spectral feature is consistent with changes in particle size or the surrounding optical environment.
Classical Mie calculations apply to spherical geometries. More complex particle shapes, such as nanorods, cubes, plates, and other anisotropic structures, require alternative numerical approaches such as the discrete dipole approximation or finite-element methods. See The Science of Plasmonics for additional background.
How Nanoparticle Properties Affect UV-Vis Spectra
Particle Size
Particle size can change resonance wavelength, peak width, extinction intensity, and the relative contributions of absorption and scattering. For plasmonic nanospheres, larger particles generally exhibit a greater scattering contribution and may show broader, red-shifted optical resonances.

Gold nanosphere extinction spectra change with particle size, including shifts in peak position and increased long-wavelength extinction for larger particles.
For more detailed examples, see Gold Nanoparticle Optical Properties and Silver Nanoparticle Optical Properties.
Particle Shape
Anisotropic nanoparticles can support multiple optical modes. Gold nanorods, for example, exhibit transverse and longitudinal plasmon resonances, while nanoprisms, plates, cubes, and other morphologies can produce additional shape-dependent spectral features.
Changes in morphology can therefore produce major spectral differences even when particle composition and approximate dimensions remain similar.
Surrounding Refractive Index
The optical resonance of many nanoparticles is sensitive to the refractive index immediately surrounding the particle surface. Increasing the local refractive index commonly shifts plasmonic resonances toward longer wavelengths.
This effect is important when nanoparticles are transferred between solvents, embedded in polymers, coated with shells or ligands, or conjugated to biomolecules. A spectral shift after surface modification does not necessarily indicate aggregation; it may reflect a change in the local dielectric environment.
Particle Concentration
For a stable dispersion within an appropriate concentration range, increasing particle concentration generally increases extinction intensity without substantially changing the intrinsic spectral shape.
If dilution or concentration produces changes in peak wavelength or shape rather than a proportional change in intensity, particle-particle interactions, aggregation, changes in medium composition, or measurement artifacts should be considered.
Using UV-Vis to Monitor Nanoparticle Aggregation
UV-Vis spectroscopy is particularly useful for monitoring the stability of plasmonic nanoparticle dispersions. As gold or silver nanoparticles move close enough for their localized plasmon modes to interact, plasmon coupling can substantially change the extinction spectrum.
Common spectral changes associated with aggregation can include:
- Reduced intensity of the original plasmon peak
- Peak broadening
- Increased extinction at longer wavelengths
- Formation of a secondary long-wavelength feature
- A shift in the apparent peak wavelength
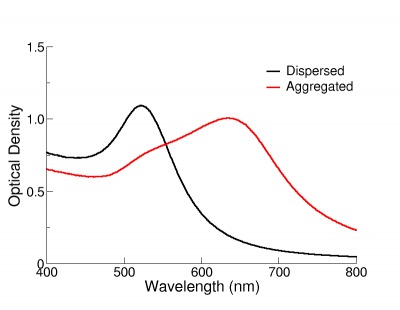
Example extinction spectra from dispersed and aggregated gold nanoparticles. Aggregation produces spectral broadening and increased extinction at longer wavelengths.
The exact spectral response depends on particle size, shape, interparticle spacing, aggregate geometry, surface chemistry, and surrounding medium, so aggregation does not produce one universal spectral signature.
For stability studies, collect a baseline spectrum before changing the formulation or exposure conditions and compare subsequent measurements using the same concentration, path length, blank, and instrument settings whenever possible.
UV-Vis can provide a sensitive indication that the dispersion has changed, but complementary methods such as DLS or TEM may be useful when quantitative information about aggregate size or primary particle morphology is required.
Troubleshooting Nanoparticle UV-Vis Measurements
| Observation | Possible Causes and Next Steps |
|---|---|
| Peak is flattened or spectrum reaches the instrument limit | The sample may be too concentrated. Dilute with a matched dispersant and remeasure within the instrument's photometric range. |
| Spectrum is noisy | Check whether the sample is too dilute, confirm adequate blanking, inspect the cuvette, and verify that sufficient transmitted light reaches the detector. |
| Baseline is elevated at long wavelengths | Increased scattering from aggregates, large particles, dust, or other particulates may be contributing to extinction. |
| Unexpected spectral shift | Consider aggregation, particle morphology, refractive-index changes, surface modification, solvent composition, or differences in blanking. |
| Spectrum changes after dilution | Dilution may have changed ionic strength, pH, ligand concentration, particle spacing, or aggregation state. Use a matched dispersant whenever possible. |
| Replicate measurements differ | Check for settling, aggregation, bubbles, inconsistent mixing, cuvette orientation, contamination, or sample instability. |
| Strong baseline offset across the spectrum | Confirm that the blank matches the sample dispersant and that the blank and sample cuvettes have equivalent optical properties. |
| Unexpected features in the UV | Check for solvent, buffer, surfactant, ligand, or cuvette absorption and confirm that the blank contains all nonparticle formulation components. |
What to Report with UV-Vis Data
For reproducible nanoparticle UV-Vis measurements, report the conditions needed to interpret and reproduce the spectrum:
- Wavelength range
- Optical path length
- Cuvette material
- Dispersing medium and blank composition
- Particle concentration or dilution factor when known
- Whether spectra are raw, dilution corrected, or normalized
- Peak wavelength and relevant spectral features
- Any sample preparation performed before measurement
When comparing nanoparticle formulations, use consistent measurement and data-processing conditions wherever possible.
Have questions about your nanoparticle UV-Vis spectra?
Talk with our technical team about spectral interpretation, sample preparation, nanoparticle aggregation, optical modeling, or complementary characterization methods.
Selected References
- Kelly, K.L., Coronado, E., Zhao, L.L., and Schatz, G.C. The Optical Properties of Metal Nanoparticles: The Influence of Size, Shape, and Dielectric Environment. Journal of Physical Chemistry B. 2003;107(3):668-677.
- Jain, P.K., Lee, K.S., El-Sayed, I.H., and El-Sayed, M.A. Calculated Absorption and Scattering Properties of Gold Nanoparticles of Different Size, Shape, and Composition: Applications in Biological Imaging and Biomedicine. Journal of Physical Chemistry B. 2006;110(14):7238-7248.
- Haiss, W., Thanh, N.T.K., Aveyard, J., and Fernig, D.G. Determination of Size and Concentration of Gold Nanoparticles from UV-Vis Spectra. Analytical Chemistry. 2007;79(11):4215-4221.
Other nanoparticle characterization guides