
No single analytical technique fully describes a nanoparticle. Physical size, morphology, hydrodynamic behavior, surface properties, optical response, elemental composition, and biological contaminants each require different measurements.
Use this overview to identify the techniques that best answer your characterization question, then explore the corresponding measurement and analysis guides for practical guidance on sample preparation, data interpretation, and common measurement challenges.
Need help characterizing your nanoparticles?
Our analytical team can support particle size, morphology, surface charge, optical properties, elemental concentration, endotoxin, and other nanoparticle measurements.
Which Nanoparticle Characterization Technique Should You Use?
Start with the property or question you need to investigate. Combining complementary techniques often provides a more complete picture than relying on a single measurement.
| Technique | What It Measures | Best Used For |
|---|---|---|
| TEM | Physical dimensions and morphology | Particle size, shape, size distribution, cores, shells, and direct imaging |
| DLS | Hydrodynamic diameter in solution | Solution-state size, aggregation, and changes in dispersion behavior |
| Zeta Potential | Electrokinetic potential at the slipping plane | Surface and formulation changes, electrostatic stabilization, and pH-dependent behavior |
| UV-Vis | Wavelength-dependent optical extinction | Plasmonic properties, aggregation, concentration comparisons, and optical stability |
| ICP-MS | Elemental identity and concentration | Total metal concentration, elemental composition, impurities, and dissolved elemental fractions |
| Endotoxin | Endotoxin activity | Biological research, formulation quality, and identifying endotoxin as an experimental confounder |
Transmission Electron Microscopy (TEM)
Transmission electron microscopy directly images a dried nanoparticle specimen at high resolution. TEM is particularly useful for measuring physical particle dimensions, morphology, size distribution, and structural features such as cores and shells.

TEM image of silica-coated gold nanoparticles

Because particles are deposited and dried onto a grid before imaging, TEM describes the physical structure of the deposited specimen rather than its hydrodynamic behavior in the original liquid. Apparent clustering on a TEM grid also does not necessarily demonstrate aggregation in solution.
For detailed guidance, see the Transmission Electron Microscopy (TEM) Imaging and Analysis Guide. For analytical testing, explore TEM Nanoparticle Analysis.
Dynamic Light Scattering (DLS)
Dynamic light scattering measures particle diffusion in a liquid and uses that behavior to calculate an equivalent hydrodynamic diameter. The result reflects the particle and the material that moves with it through solution, including surface coatings, adsorbed molecules, and associated solvent layers.

DLS is useful for monitoring colloidal size, aggregation, and changes in dispersion state. Because scattering is strongly influenced by larger particles, aggregates or other large species can disproportionately affect the measured intensity distribution.
TEM and DLS therefore answer different questions. TEM measures physical particle dimensions in a dried specimen, while DLS measures hydrodynamic behavior in the liquid dispersion.
For detailed guidance, see the Dynamic Light Scattering (DLS) Measurement and Analysis Guide. For analytical testing, explore DLS Nanoparticle Analysis.
Zeta Potential
Zeta potential describes the electrokinetic potential at the slipping plane surrounding a dispersed particle. It is inferred from electrophoretic mobility and depends on the nanoparticle surface as well as the surrounding solution.

Zeta potential can help identify changes in surface chemistry, formulation conditions, electrostatic stabilization, and pH-dependent behavior. Results should always be interpreted in the context of measurement conditions such as pH and ionic strength. A single zeta potential value is not a universal measure of nanoparticle stability, particularly for particles stabilized through steric interactions.
For detailed guidance, see the Zeta Potential Measurement and Analysis Guide. For analytical testing, explore Zeta Potential Nanoparticle Analysis.
UV-Vis Spectroscopy
UV-Vis spectroscopy measures wavelength-dependent optical extinction. In conventional transmission measurements of nanoparticle dispersions, extinction reflects light removed from the transmitted beam through both absorption and scattering.
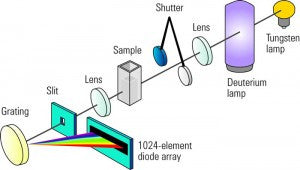
UV-Vis is particularly informative for plasmonic nanoparticles such as gold and silver because their spectra respond to particle size, shape, concentration, aggregation, and the local refractive index. Changes in peak wavelength, spectral width, peak shape, or long-wavelength extinction can provide sensitive indicators of changes in the nanoparticle system.
For detailed guidance, see the UV-Vis Spectroscopy Measurement and Analysis Guide. You can also use the Mie Theory Calculator to model spherical and core-shell particle spectra or the UV-Vis Data Analysis Spreadsheet to process experimental data.
For analytical testing, explore UV-Visible Nanoparticle Analysis.
Inductively Coupled Plasma Mass Spectrometry (ICP-MS)
ICP-MS identifies and quantifies elements at very low concentrations. For metallic and metal-containing nanoparticles, it is useful for measuring total elemental concentration, elemental composition, trace impurities, and appropriately prepared dissolved fractions.
Conventional ICP-MS measures elemental ions rather than intact nanoparticles. Sample preparation should therefore be selected according to the quantity being measured. Total-element measurements often require digestion, while measurements of dissolved material require a validated method for separating particles from the analyzed fraction.
Single-particle ICP-MS is a related approach that can provide particle number concentration and elemental mass per particle under appropriate measurement conditions and model assumptions.
For detailed guidance, see the ICP-MS Measurement and Analysis Guide. For analytical testing, explore Metal Concentration Analysis with ICP-MS.
Endotoxin Analysis
Endotoxin is a lipopolysaccharide associated with the outer membrane of gram-negative bacteria. Even low levels can influence biological experiments, particularly studies involving inflammatory or immune responses.
Nanoparticle formulations can complicate endotoxin testing through optical interference, aggregation, adsorption, or interactions with assay reagents. Appropriate inhibition and enhancement controls are therefore important when demonstrating that an assay performs reliably with a specific nanoparticle sample.
Endotoxin testing answers a different question from physical or chemical nanoparticle characterization, but it can be an essential part of characterizing materials intended for biological research and development.
For detailed guidance, see the Endotoxin Measurement and Analysis Guide. For analytical testing, explore Endotoxin Testing of Nanoparticles.
Complementary Nanoparticle Characterization Techniques
The methods above address many common nanoparticle characterization questions, but additional techniques may be useful depending on the material and application.
Dark-Field Microscopy
Dark-field microscopy collects light scattered by a sample while excluding directly transmitted illumination. Strongly scattering nanoparticles can therefore appear as bright spots against a dark background.
The technique is especially useful for visualizing larger or strongly scattering plasmonic nanoparticles such as gold and silver. Because the apparent image size is limited by the optical system, dark-field microscopy should not be used to directly determine nanoparticle diameter. Instead, it can provide information about particle location, scattering intensity, color, aggregation, or interactions with surrounding structures.
For more information on nanoparticle scattering, see Gold Nanoparticle Optical Properties and the Mie Theory Calculator.
Other Complementary Methods
Depending on the particle system and measurement question, techniques such as nanoparticle tracking analysis (NTA), differential centrifugal sedimentation (DCS), scanning electron microscopy (SEM), atomic force microscopy (AFM), spectroscopy, chromatography, or surface-specific analytical methods may provide additional information.
Method selection should begin with the physical or chemical property you need to measure rather than with the availability of a particular instrument.
How Characterization Methods Work Together
Measurements that appear to describe the same nanoparticle property may actually probe different aspects of the sample. Combining methods can help distinguish these effects.
| Question | Useful Approach |
|---|---|
| What is the physical particle size and morphology? | Use TEM for direct imaging of particle dimensions and shape. |
| What is the particle size in solution? | Use DLS to evaluate hydrodynamic diameter and dispersion behavior, with TEM providing complementary physical dimensions. |
| Are the particles aggregating? | Use DLS to monitor hydrodynamic size. For plasmonic particles, UV-Vis can provide complementary evidence through changes in the optical spectrum. |
| Did surface modification change the particle? | Combine zeta potential with DLS and, where appropriate, UV-Vis or other surface-specific analytical methods. |
| Did a plasmonic nanoparticle remain optically stable? | Use UV-Vis to monitor spectral shifts, broadening, or changes in long-wavelength extinction and DLS to evaluate solution-state size. |
| How much of a particular element is present? | Use ICP-MS for elemental concentration and pair it with particle-sizing methods when particle size or number also matters. |
| Could endotoxin be affecting a biological experiment? | Perform an appropriately qualified endotoxin assay with controls for nanoparticle-related interference. |
Nanoparticle Characterization Guides
Explore practical guidance on measurement conditions, sample preparation, data interpretation, and common analytical challenges:
- Dynamic Light Scattering (DLS) Measurement and Analysis Guide
- Zeta Potential Measurement and Analysis Guide
- UV-Vis Spectroscopy Measurement and Analysis Guide
- Transmission Electron Microscopy (TEM) Imaging and Analysis Guide
- ICP-MS Measurement and Analysis Guide
- Endotoxin Measurement and Analysis Guide
Need help selecting the right measurements?
Our technical team can help determine which characterization methods are appropriate for your nanoparticle, formulation, and application.